2013 UK local government election
The Surrey County Council election, 2013 took place on 2 May 2013 as part of the 2013 United Kingdom local elections .[1]
All locally registered electors (British, Irish, Commonwealth and European Union citizens) who were aged 18 or over on Thursday 2 May 2013 were entitled to vote in the local elections. Those who were temporarily away from their ordinary address (for example, away working, on holiday, in student accommodation or in hospital) were also entitled to vote in the local elections,[2] [3]
Summary Despite suffering the loss of 335 of 1451 councillors in simultaneous elections across England ,[4] Green Party gained three seats and one seat respectively from the Conservatives to win their first representation on the council at this election. The Labour Party retained their only seat on the council.
Electoral Review For these elections the number of seats in the Council increased from 80 to 81 implementing, with a minor change, recommendations of the 2010 review by the Local Government Boundary Commission for England.[5]
Waverley’s average division size would become 12,015 [electors], over 8% larger than the target size for the County. Given this and Waverley’s geographical nature, it would be extremely difficult to meet the Commission’s criteria regarding electoral equality whilst also meeting the other two criteria of community identity and convenient and effective local government.
[6]
Therefore, although the threshold for electoral inequality is 10% variation from the average, which must be reached in 33% of divisions to trigger a boundary commission review, the Council relied in evidence on the fact that Waverley's projected electorate in 2016 would be the most disparate above the quota. Others were over-represented falling below the quota and opponents argued for instead, their removal. Determined to keep a minimum of 80 councillors, Surrey County Council stated that Waverley would be, in its view, unacceptably under-represented and so advocated 81 seats in its final, modified size submission of March 2011.[6] [5]
The boundary review resulted generally to minor revisions all of which were only to a minority of divisions, with consequential name changes in a few instances.[5]
Candidates The only party which nominated candidates in all 81 divisions were UKIP , followed by the Conservative Party, who contested 80 divisions. The Labour Party stood in 78 divisions and the Liberal Democrats contested 76 divisions.[7]
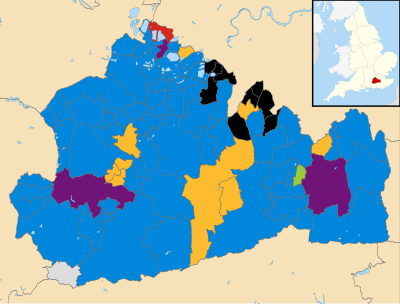
Results The distribution of seats after the 2013 Surrey County Council Election Surrey County Council election, 2013 Party Seats Gains Losses Net gain/loss Seats % Votes % Votes +/− Conservative 58 6 4 +2 72 39.6 102,121 -54,107 Liberal Democrats 9 0 4 -4 11 15.7 40,609 -51,059 Residents 8 0 1 -1 10 6.4 18,660 -1,390 UKIP 3 3 0 +3 4 22.3 57,598 23,671 Labour 1 0 0 ±0 1 10.8 27,782 8,389 Independent 1 0 0 ±0 1 3.35 6,051 -2,454 Green 1 1 0 +1 1 1.6 4,090 -2,321 Peace 0 0 0 ±0 0 0.1 297 150 Monster Raving Loony 0 0 0 ±0 0 0.05 127 BNP 0 0 0 ±0 0 0.04 98 -1,520 UK Community Issues Party 0 0 0 ±0 0 0.02 43 English Democrat 0 0 0 ±0 0 0.02 39
[7]
Results by district [7]
Surrey County Council is split into 81 single-member electoral divisions. These are grouped into 11 districts, each of which has between 6 and 10 divisions.[6]
Cobham[8] Party Candidate Votes % ±% Conservative Mary Lewis 1,524 57 -12.8 UKIP Richard Atkins 651 24 Liberal Democrats David Bellchamber 295 11 -12.7 Labour Carolyn Gray 197 7 1.6 Majority Turnout 2,667 25.85 -10.65 Conservative hold Swing
East Molesey & Esher[9] Party Candidate Votes % ±% Residents Stuart Selleck 1,134 41 -4 Conservative Steve Bax 1,110 41 -2.1 UKIP Trevor Marshall 291 11 Labour Irene Threlkeld 107 4 1.1 Liberal Democrats Paul Nagle 63 2 -6.7 Monster Raving Loony Chinners 34 1 Majority Turnout 2,739 28.61 -14.29 Residents hold Swing
Hersham[10] Party Candidate Votes % ±% Conservative Margaret Hicks 1,323 40 -1.7 Hersham Village Society Roy Green 1,153 35 UKIP Richard Newbold 459 14 Labour Irene Hamilton 245 7 0.1 Liberal Democrats Simon Lumb 120 4 -7.1 Majority 170 Turnout 3,300 32.80 -8.8 Conservative hold Swing
Hinchley Wood, Claygate & Oxshott[11] Party Candidate Votes % ±% Conservative Mike Bennison 1,943 50 Liberal Democrats Keya Ashraf 1,153 30 UKIP Bernard Collignon 569 15 Labour Sheila Francis 220 6 Majority Turnout 3,885 32.48 -13.12 Conservative hold Swing
The Dittons[12] Party Candidate Votes % ±% Residents Peter Hickman 1,861 55 Conservative Robert Stead 624 18 UKIP Susannah Cunningham 483 14 Labour Francis Eldergill 219 6 Liberal Democrats Mike Smith 203 6 Majority Turnout 3,390 29.01 Residents hold Swing
Walton[13] Party Candidate Votes % ±% Conservative Rachael Lake 1,045 37 The Walton Society Mike Collins 904 32 UKIP Anita Wooldridge 445 16 Labour Peter Hawkes 316 11 Liberal Democrats Sereena Davey 97 3 Majority Turnout 2,807 25.25 Conservative gain from Residents Swing 3.4
Walton South & Oatlands[14] Party Candidate Votes % ±% Conservative Tony Samuels 1,682 57 UKIP Gillian Grant 584 20 Labour Margaret Hawkes 350 12 Liberal Democrats John Smith 322 11 Majority Turnout 2,938 26.99 Conservative hold Swing
West Molesey[15] Party Candidate Votes % ±% Residents Ernest Mallett 1,947 71 UKIP Steve Clements 353< 13 Conservative Christine Elmer 265 10 Liberal Democrats Alastair Sturgis 73 3 Labour Matt Willey 57 2 Monster Raving Loony Crazy Dave 41 1 Majority Turnout 2,736 27.16 Residents hold Swing
Weybridge[16] Party Candidate Votes % ±% Conservative Christian Mahne 991 32 Independent Peter Harman 792 25 Liberal Democrats Andrew Davis 650 21 UKIP Ian Lake 524 17 Labour Martin Lister 158 5 Majority Turnout 3,115 27.95 Conservative hold Swing
Epsom Town & Downs Party Candidate Votes % ±% Conservative Tina Mountain 1,448 39 Residents Neil Dallen 1,060 28 UKIP Iain Bonner-Fomes 502 13 Liberal Democrats Alison Kelly 423 11 Labour Kate Chinn 289 8 Majority Turnout 33 Conservative gain from Residents Swing
Epsom West Party Candidate Votes % ±% Liberal Democrats Stella Lallement 854 28 Residents Paul Ardern-Jones 693 23 Labour Steve Dyke 616 20 UKIP Davi Crawford 494 16 Conservative Mhairi Fraser 389 13 Majority Turnout 29 Liberal Democrats hold Swing
Ewell Party Candidate Votes % ±% Residents John Beckett 2,065 63 UKIP David Hunt 539 16 Conservative Alison Chatterton 359 11 Labour Rosemary Taylor 148 5 Liberal Democrats Jim Dapre 84 3 Green Donna O'Brien 76 2 Majority Turnout 27 Residents hold Swing
Ewell Court, Auriol & Cuddington Party Candidate Votes % ±% Residents Eber Kington 2,233 64 UKIP Roger Kemp 624 18 Conservative Carole Edwards 310 9 Labour Colin Luxton 206 6 Liberal Democrats Rusmat Ahmed 90 3 Majority Turnout 28 Residents hold Swing
West Ewell Party Candidate Votes % ±% Residents Jan Mason 1,373 49 UKIP Bob Cane 495 18 Conservative Stephen Pontin 419 15 Labour Rob Geleit 370 13 Liberal Democrats Julia Kirkland 145 5 Majority Turnout 24 Residents hold Swing
Guildford Ash Party Candidate Votes % ±% Conservative Marsha Molesey 1,312 47 UKIP Mazhar Manzoor 573 21 Liberal Democrats Alan Hilliar 568 20 Labour Joan O'Bryne 329 12 Majority Turnout 28 Conservative hold Swing
Guildford East Party Candidate Votes % ±% Conservative Graham Ellwood 1,874 50 Liberal Democrats Ted Mayne 931 25 UKIP Colin Reardon 568 15 Labour Malcolm Hill 384 10 Majority Turnout 36 Conservative hold Swing
Guildford North Party Candidate Votes % ±% Liberal Democrats Pauline Searle 1,115 35 Conservative Sharon Stokes 775 24 UKIP David Sheppard 659 21 Labour Michael Hassell 648 20 Majority Turnout 27 Liberal Democrats hold Swing
Guildford South-East Party Candidate Votes % ±% Conservative Mark Brett-Warburton 1,865 53 Liberal Democrats Kelly-Maire Blundell 905 26 UKIP Nyree Wadman 426 12 Labour Rajanathan Rajasingham 307 9 Majority Turnout 33 Conservative hold Swing
Guildford South-West Party Candidate Votes % ±% Liberal Democrats David Goodwin 1,189 38 Conservative Nils Christiansen 1,039 33 Labour Mary Davies 411 13 UKIP Laura McEvoy 409 13 Peace Tom May 117 4 Majority Turnout 29 Liberal Democrats hold Swing
Guildford West Party Candidate Votes % ±% Liberal Democrats Fiona White 732 35 Labour Brian Walter 494 24 UKIP Laurence Hodge 435 21 Conservative Chris Varveris 325 16 Peace John Morris 105 5 Majority Turnout 20 Liberal Democrats hold Swing
Horsleys Party Candidate Votes % ±% Conservative Bill Barker 2,177 60 UKIP Garreth Evans 750 21 Liberal Democrats Arnold Pindar 429 12 Labour Carolyn Fiddes 258 7 Majority Turnout 36 Conservative hold Swing
Shalford Party Candidate Votes % ±% UKIP George Johnson 1,411 51 Liberal Democrats George Potter 1,023 37 Labour Rose Seber 347 12 Majority Turnout 27 UKIP gain from Conservative Swing
Shere Party Candidate Votes % ±% Conservative Keith Taylor 1,907 57 UKIP Donna Walker 778 23 Liberal Democrats Marilyn Merryweather 361 11 Labour Robin Woof 309 9 Majority Turnout 34 Conservative hold Swing
Worplesdon Party Candidate Votes % ±% Conservative Keith Witham 1,816 51 UKIP Terry Wadman 777 22 Liberal Democrats Paul Cragg 609 17 Labour Michael Jeram 332 9 Majority Turnout 32 Conservative hold Swing
Ashtead[17] Party Candidate Votes % ±% Independent Christopher Townsend 2,283 53 Conservative Tim Ashton 1,332 31 UKIP Adrian Daniels 465 11 Labour Susan Gilchrist 166 4 Liberal Democrats Penelope Becker 95 2 Majority Turnout 4,341 38.51 Independent hold Swing
Bookham and Fetcham West Party Candidate Votes % ±% Conservative Clare Curran 2,115 46 Liberal Democrats Andrew Freeman 1,218 26 UKIP Mike Heelas 1,104 23 Labour Keith Davis 259 5 Majority Turnout 39 Conservative hold Swing
Dorking Hills Party Candidate Votes % ±% Liberal Democrats Hazel Watson 2,043 46 Conservative Lynne Hack 1,189 27 UKIP Apolinario Afonso 847 19 Green Jacquetta Fewster 200 5 Labour Jonathan Orde 151 3 Majority Turnout 41 Liberal Democrats hold Swing
Dorking Rural Party Candidate Votes % ±% Conservative Helyn Clack 1,810 40 Liberal Democrats Michael Ward 1,527 34 UKIP Leigh Jones 935 21 Labour Malcolm Ward 261 6 Majority Turnout 41 Conservative hold Swing
Dorking South and the Holmwoods Party Candidate Votes % ±% Liberal Democrats Stephen Cooksey 1,532 42 Conservative James Morton 974 27 UKIP Michael Foulston 774 21 Labour Frank Pemberton 328 9 Turnout 38 Liberal Democrats hold Swing
Leatherhead and Fetcham East Party Candidate Votes % ±% Conservative Tim Hall 1,564 42 UKIP Roger Bird 1,048 28 Liberal Democrats Bridget Lewis-Carr 782 21 Labour Robert Mallon 297 8 Majority Turnout 31.5 Conservative hold Swing
Banstead, Woodmansterne & Chipstead Party Candidate Votes % ±% Conservative Ken Gulati 1497 UKIP Chris Byrne 994 Green Phil Wilson 272 Liberal Democrats Helen Kulka 233 Majority 503 16.8 Turnout 2,996 26 Conservative hold Swing
Earlswood and Reigate South[18] Party Candidate Votes % ±% Conservative Barbara Thomas 955 33 UKIP Joseph Fox 899 31 Labour Graham Wildridge 615 21 Green Katie Smith 235 8 Liberal Democrats Anthony Lambell 219 7 Majority Turnout 2,923 28.41 Conservative hold Swing
Horley East[19] Party Candidate Votes % ±% Conservative Dorothy Ross-Tomlin 1,069 47 UKIP Christian Stevens 716 31 Labour Linda Mabbett 253 11 Liberal Democrats Tim Deevoy 215 9 Majority Turnout 2,281 24.72 Conservative hold Swing
Horley West, Salfords and Sidlow[20] Party Candidate Votes % ±% Conservative Kay Hammond 1,038 42 UKIP Timothy Brooke-Harte 889 36 Labour Rosie Norgrove 335 14 Liberal Democrats Barry Hamilton 215 9 Majority Turnout 2,477 25.72 Conservative hold Swing
Merstham and Banstead South[21] Party Candidate Votes % ±% Conservative Bob Gardner 1,095 44 UKIP Bob Cambridge 698 28 Labour Julie Halford 450 18 Liberal Democrats Christopher Howell 271 11 Turnout 2,514 25.33 Conservative hold Swing
Nork and Tattenhams[22] Party Candidate Votes % ±% Residents Association Nick Harrison 1,954 54 UKIP Andre Grant 583 18 Conservative Patsy Shillinglaw 517 16 Labour Clive Scott 111 3 Liberal Democrats Stephen Gee 91 3 Green Derek Smith 53 2 Turnout 3,309 28.08 Residents' Association hold Swing
Redhill East[23] Party Candidate Votes % ±% Green Jonathan Essex 1,457 50 Conservative Richard Coad 645 22 UKIP Colin Stiff 379 13 Labour Stewart Dack 345 12 Liberal Democrats Andrew Cressy 103 4 Turnout 2,929 28.91 Green gain from Conservative Swing
Redhill West and Meadvale[24] Party Candidate Votes % ±% Conservative Natalie Bramhall 995 30 Green Sarah Finch 700 21 UKIP Tim Pearson 633 19 Liberal Democrats Peter Lambell 587 18 Labour John Berge 364 11 Turnout 3,279 32.23 Conservative hold Swing
Reigate[25] Party Candidate Votes % ±% Conservative Zully Grant-Duff 1,588 49 Liberal Democrats William Dyer 579 18 UKIP Stephen Russell 515 16 Labour Andrew Saunders 281 9 Green Bryn Truscott 268 8 Turnout 3,231 31.01 Conservative hold Swing
Tadworth, Walton and Kingswood[26] Party Candidate Votes % ±% Conservative Michael Gosling 1,500 53 UKIP Robert Leach 901 32 Green Alistair Morten 230 8 Liberal Democrats Judith Briony 201 7 Turnout 2,832 26.73 Conservative hold Swing
Runnymede Addlestone Party Candidate Votes % ±% Conservative John Furey 1,146 39.6 UKIP Toby Micklethwait 922 31.9 Labour Arran Neathey 589 20.4 Liberal Democrats Andrew Falconer 182 6 Monster Raving Loony Crazy Crab 52 2 Majority Turnout 26 Conservative hold Swing
Chertsey Party Candidate Votes % ±% Conservative Chris Norman 1284 41.9 UKIP Adam Shire 962 31.4 Labour Lee Godfrey 819 26.7 Majority Turnout 28 Conservative hold Swing
Egham Party Candidate Votes % ±% Conservative Yvonna Lay 730 42.4 UKIP Gwendoline Cornell 481 27.9 Labour David Bell 341 19.8 Liberal Democrats Dorian Mead 169 10 Majority Turnout 21 Conservative hold Swing
Englefield Green Party Candidate Votes % ±% Conservative Marisa Heath 950 42.7 UKIP John Gynn 541 24.3 Labour Jack Killian 349 15.7 Green Rustam Majainah 224 10 Liberal Democrats Andy Watson 159 7 Majority Turnout 19.5 Conservative hold Swing
Foxhills, Thorpe and Virginia Water Party Candidate Votes % ±% Conservative Mel Few 1,540 53.0 UKIP Graham Wood 832 28.6 Labour John Gurney 362 12.4 Liberal Democrats Ian Heath 174 6 Majority Turnout 27 Conservative hold Swing
Woodham and New Haw Party Candidate Votes % ±% Conservative Mary Angell 1,301 47.3 UKIP David Roe 850 30.9 Labour Anne Emerson 357 13.0 Liberal Democrats Jennifer Coulon 242 9 Majority Turnout 28 Conservative hold Swing
Ashford[27] Party Candidate Votes % ±% Conservative Carol Ann Coleman 1,299 44 UKIP Robert Bromley 964 33 Labour Joe Miller 511 17 Liberal Democrats Kelvin Gardiner 155 5 Turnout 2,929 27.43 Conservative hold Swing
Laleham and Shepperton Party Candidate Votes % ±% Conservative Richard Walsh 1,701 53 UKIP Linda Thatcher 902 28 Labour John Went 374 12 Liberal Democrats Richard Dunn 246 8 Majority Turnout 31 Conservative hold Swing
Lower Sunbury & Halliford Party Candidate Votes % ±% Conservative Tim Evans 1,117 37 Liberal Democrats Sandra Dunn 1,023 34 UKIP Nick Wood 877 29 Majority Turnout 29 Conservative gain from Liberal Democrats Swing
Staines Party Candidate Votes % ±% Conservative Denise Saliagopoulos 1,307 47 UKIP Marlon Kincses 622 22 Labour Imtiaz Khan 371 13 Liberal Democrats Susan Vincent 239 9 Independent Jacqueline Stanton 231 8 Majority Turnout 26 Conservative hold Swing
Staines South & Ashford West Party Candidate Votes % ±% UKIP Daniel Jenkins 1,175 38 Conservative Denise Turner-Stewart 1,171 38 Labour John Johnston 630 20 Liberal Democrats Jon Edwards 119 4 Majority Turnout 28 UKIP gain from Conservative Swing
Stanwell & Stanwell Moor Party Candidate Votes % ±% Labour Robert Evans 847 35 Conservative Colin Davis 599 25 UKIP Geoff Cox 588 24 Independent Kevin Flurry 253 11 Liberal Democrats Fares Georges 117 5 Majority Turnout 24 Labour hold Swing {{{swing}}}
Sunbury Common & Ashford Common Party Candidate Votes % ±% Liberal Democrats Ian Beardsmore 1025 40 UKIP Mark Fowler 658 25 Conservative Chris Frazer 549 21 Labour Sarah Wrightson 358 14 Majority Turnout 22 Liberal Democrats hold Swing
Bagshot, Windlesham and Chobham Party Candidate Votes % ±% Conservative Mike Goodman 1,674 54 UKIP Robert Shatwell 690 22 Labour Richard Wilson 426 14 Liberal Democrats Ruth Hutchinson 333 11 Majority 984 32 Turnout 3,123 28 Conservative hold Swing
Camberley East Party Candidate Votes % ±% Conservative Bill Chapman 1,323 52 -4.3 UKIP John Bevan 753 30 14.6 Labour Linda Philippson 454 18 8.4 Majority 570 22 -18.6 Turnout 2,530 23 -10.7 Conservative hold Swing -4.3
Camberley West Party Candidate Votes % ±% Conservative Denis Fuller 1,468 45 -5.5 Labour Rodney Bates 991 31 21.3 UKIP Alexander Remfry 788 24 8.4 Majority 477 14 -18.2 Turnout 3,247 28 -7.5 Conservative hold Swing -5.5
Frimley Green and Mytchett Party Candidate Votes % ±% Conservative Chris Pitt 962 36 -7.1 UKIP Paul Chapman 867 33 21.4 Liberal Democrats Cindy Ferguson 481 18 -24.2 Labour Jacques Olmo 326 12 9 Majority 95 3 2.1 Turnout 2,636 25 -18 Conservative hold Swing -7.1
Heatherside and Parkside Party Candidate Votes % ±% Conservative David Ivison 1,438 52 -0.6 UKIP Andrew Thomas 701 25 12 Liberal Democrats Graham Tapper 431 15 -16 Labour Paul Tonks 214 8 4 Majority 737 27 5.1 Turnout 2,784 26 -15 Conservative hold Swing -0.6
Lightwater, West End and Bisley Party Candidate Votes % ±% Conservative Adrian Page 1,562 52 UKIP Richard Squire 845 28 Labour Mick Sheehan 328 11 Liberal Democrats Fran Bennie 286 9 Majority 717 14 Turnout 3,021 26 Conservative hold Swing
Caterham Hill Party Candidate Votes % ±% Liberal Democrats John Orrick 1,625 46.2 Conservative Eithne Webster 1,008 28.7 UKIP Tony Baker 688 19.6 Labour Etna Houldsworth 196 6 Majority Turnout 33 Liberal Democrats hold Swing
Caterham Valley Party Candidate Votes % ±% Conservative Sally Marks 1,090 40.5 Liberal Democrats David Lee 694 25.8 UKIP Jeffrey Bolter 567 21.1 Labour John Burgess 209 8 Green Les Adams 129 5 Majority Turnout 30 Conservative hold Swing
Godstone Party Candidate Votes % ±% UKIP Helena Windsor 1,625 39.9 Conservative Graham Knight 1,171 38.5 Liberal Democrats Richard Fowler 359 11.8 Labour Linda Baharier 257 8 English Democrat Daniel Beddoes 39 1 Majority Turnout 33 UKIP gain from Conservative Swing
Lingfield Party Candidate Votes % ±% Conservative Michael Sydney 1,488 55.2 Independent Christopher D'Avray 1,171 30 UKIP Graham Bailey 952 25 Labour Stephen Case-Green 257 7 Majority Turnout 33 Conservative hold Swing
Oxted Party Candidate Votes % ±% Conservative Nick Skellett 1,894 44.6 UKIP Christopher Dean 1,245 29.3 Labour Terry Philpot 478 11.3 Liberal Democrats Peter Roberts 381 9 Green James Thompson-Stewart 246 6 Majority Turnout 36 Conservative hold Swing
Warlingham Party Candidate Votes % ±% Conservative David Hodge 1,444 42.4 UKIP Martin Arthur 1,075 31.5 Liberal Democrats Simon Morrow 743 21.8 Labour Sarah MacDonnell 146 4 Majority Turnout 34 Conservative hold Swing
Cranleigh & Ewhurst Party Candidate Votes % ±% Conservative Alan Young 1,842 51 UKIP Simon Brind 935 26 Liberal Democrats Ken Reed 523 14 Labour Lynda MacDermott 334 9 Majority Turnout 33 Conservative hold Swing
Farnham Central Party Candidate Votes % ±% Conservative Pat Frost 1,035 UKIP Bob Nockels 697 22 Independent Mike Bryan 583 Liberal Democrats Stewart Edge 562 18 Labour Hadleigh Roberts 236 8 Majority Turnout 30 Conservative hold Swing
Farnham North Party Candidate Votes % ±% Conservative Denise LeGal 1,005 32 UKIP Alexandra Swann 962 31 Independent Jerry Hyman 575 18 Liberal Democrats Mark Norris 349 11 Labour Janet Fearnley 231 7 Majority Turnout 31 Conservative hold Swing
Farnham South Party Candidate Votes % ±% Conservative David Munro 1,677 50 UKIP Ivo Weck 542 16 Independent Mark Westcott 542 16 Independent David Beaman 344 10 Labour Joan Anniballi 233 7 Majority Turnout 34 Conservative hold Swing
Godalming North Party Candidate Votes % ±% Conservative Steve Cosser 1,541 44 Liberal Democrats Patrick Haveron 731 21 UKIP Jon Swainson 659 19 Labour Robert Park 563 16 Majority Turnout 31 Conservative hold Swing
Godalming South, Milford & Witley Party Candidate Votes % ±% Conservative Peter Martin 2,062 57 UKIP Tim Clark 793 22 Liberal Democrats Paul Farthing 429 12 Labour Michael Williams 327 9 Majority Turnout 33 Conservative hold Swing
Haslemere Party Candidate Votes % ±% Independent Nikki Barton 1,208 35 Conservative Stephen Mulliner 1,188 35 UKIP Patricia Culligan 573 17 Labour Nick Scales 154 5 Liberal Democrats Peter Nicholson 285 8 Majority Turnout 35 Independent gain from Conservative Swing
Waverley Eastern Villages Party Candidate Votes % ±% Conservative Victoria Young 2,039 59 UKIP Hugo Alexander 744 22 Liberal Democrats Richard Cole 366 11 Labour Tony Johnson 311 9 Majority Turnout 32 Conservative win (new seat)
Waverley Western Villages Party Candidate Votes % ±% Conservative David Harmer 1,880 61 UKIP Gail Weingartner 693 22 Liberal Democrats Geoffrey Whitby 299 10 Labour Andrew Desmond 231 7 Majority Turnout 32 Conservative hold Swing
Woking Goldsworth East and Horsell Village[28] Party Candidate Votes % ±% Conservative Colin Kemp 1,343 36 Liberal Democrats Ann-Marie Barker 1,249 34 UKIP Howard Earl 681 18 Labour Akhil Viren 441 12 Majority Turnout 3,728 33.01 Conservative gain from Liberal Democrats Swing
Knaphill and Goldsworth West[28] Party Candidate Votes % ±% Conservative Saj Hussain 1,771 49 Liberal Democrats Tina Liddington 716 20 UKIP Matthew Davies 537 15 Independent Martin Dunham 352 10 Labour Paul Brown 255 7 Majority Turnout 3,642 33.05 Conservative gain from Liberal Democrats Swing
The Byfleets[28] Party Candidate Votes % ±% Conservative Richard Wilson 1,476 50 -2.1 UKIP Terry Knight 597 20 Liberal Democrats Andy Grimshaw 533 18 Labour Anthony William Mullins 231 8 BNP Chris Jones 98 3 Majority Turnout 2,945 29.40 Conservative hold Swing -2.1
Woking North[28] Party Candidate Votes % ±% Conservative Ben Carasco 1,456 36 Labour Mohammad Raja 1,305 32 Liberal Democrats Muhammed Imran 672 17 UKIP Timothy Shaw 565 14 UK Community Issues Party Michael Osman 43 1 Majority Turnout 4,062 36.87 Conservative hold Swing
Woking South[28] Party Candidate Votes % ±% Liberal Democrats Will Forster 1,449 43 -3.6 Conservative Simon Bellord 963 29 UKIP Rob Burberry 575 17 Labour Stephen William Tudhope 270 8 Peace Julie Roxburgh 75 2 Majority Turnout 3,336 30.79 Liberal Democrats hold Swing -3.6
Woking South East[28] Party Candidate Votes % ±% Conservative Liz Bowes 1,843 58 UKIP Robin Milner 618 19 Liberal Democrats Liam Lyons 407 13 Labour Alex Denning 318 10 Majority Turnout 3,198 31.42 Conservative hold Swing
Woking South West Party Candidate Votes % ±% Conservative Linda Kemeny 1,339 48 UKIP Marcia Taylor 589 21 Liberal Democrats Ken Howard 564 20 Labour Tom Willis 293 11 Majority Turnout 2,796 29.24 Conservative hold Swing
References ^ "County council elections 2013". Surrey County Council. 12 April 2013. Retrieved 14 April 2013 . ^ "The Representation of the People (Form of Canvass) (England and Wales) Regulations 2006, Schedule Part 1". Legislation.gov.uk. 13 October 2011. Retrieved 18 April 2012 . ^ "I have two homes. Can I register at both addresses?". The Electoral Commission. Archived from the original on 15 November 2008. Retrieved 5 January 2011 . ^ BBC News Vote 2013. Retrieved 2013-05-05 ^ a b c lgbce.org Archived 15 May 2013 at the Wayback Machine All reviews: South East: Surrey. Retrieved 2013-05-05 ^ a b c lgbce.org Archived 4 June 2012 at the Wayback Machine "Surrey Council size submissions." Retrieved 2013-05-05 ^ a b c Surrey County Council County Council Election Results. Retrieved 2013-5-5 ^ Election results for Cobham, Surrey County Council website ^ Election results for East Molesey and Esher, Surrey County Council website ^ Election results for Hersham, Surrey County Council website ^ Election results for Hinchley Wood, Claygate and Oxshott, Surrey County Council Website ^ Election results for The Dittons, Surrey County Council website ^ Election results for Walton, Surrey County Council website ^ Election results for Walton South & Oatlands, Surrey County Council website ^ Election results for West Molesey, Surrey County Council website ^ Election results for Weybridge, Surrey County Council website ^ Election results for Ashtead ^ Election results for Earlswood and Reigate South, Surrey County Council website ^ Election results for Horley East, Surrey County Council website ^ Election results for Horley West, Salfords & Sidlow, Surrey County Council website ^ Election results for Merstham & Banstead South, Surrey County Council website ^ Election results for Nork & Tattenhams, Surrey County Council website ^ Election results for Redhill East, Surrey County Council website ^ Election results for Redhill West & Meadvale, Surrey County Council website ^ Election results for Reigate, Surrey County Council website ^ Election results for Tadworth, Walton & Kingswood, Surrey County Council website ^ Election results for Ashford, Surrey County Council website ^ a b c d e f Election of Councillors for the Electoral Divisions of Surrey County Council Summary of Results: Thursday 2 May 2013 (PDF)


 Council elections in Surrey


